At 50 products, you can keep everything in your head. At 200, spreadsheets start failing. At 500+, you need a system. The sellers who scale beyond 1,000 SKUs without drowning in complexity share one trait: they've built a tagging taxonomy that makes sense for their business.
Product tagging isn't glamorous. It doesn't show up in revenue reports. But it's the infrastructure that makes everything else possible. Without it, you can't answer basic questions: Which supplier's products are most profitable? How are Q4 launches performing versus Q1? Which category should get more ad budget?
This guide shows you how to build a tagging system that scales. You'll learn the difference between categories, attributes, and performance tiers. You'll see strategies for single brands, multi-brand portfolios, and agencies. And you'll get a migration plan for moving from spreadsheet chaos to systematic organization.
Spreadsheet Breaking Point
200-300
SKUs before manual tracking fails
Analysis Time Saved
70%
With proper tagging vs. Manual filtering
Better Decisions
3x
Faster with segment-level visibility
Why spreadsheet organization fails at scale
Every seller starts with spreadsheets. They work fine at first. You list products, add columns for notes, maybe color-code by category. Then you add a second marketplace. Then a new supplier. Then someone asks "how are our summer launches doing?" and you realize you need to manually filter, cross-reference, and calculate across three sheets.
Spreadsheets fail because they're static. Every new question requires manual work. They don't connect to your live data. And they require discipline that breaks down when you're busy with actual selling.
The Real Cost of Spreadsheet Chaos
A mid-sized seller managing 400 SKUs across 3 marketplaces typically spends 5-8 hours per week just maintaining spreadsheets and answering ad-hoc questions. That's 260-400 hours per year. At $50/hour opportunity cost, you're burning $13,000-20,000 annually on organization overhead.
The alternative isn't more discipline with spreadsheets. It's building a tagging system where organization is automatic and analysis is instant.
Spreadsheet Approach
Tagging System Approach
Manual filtering every time
One-click segment views
Data goes stale within days
Live data always current
New questions require rework
Tags enable any slice of data
One person owns the spreadsheet
Team-wide visibility
No connection to P&L
Profit data by segment
What a tagging system looks like
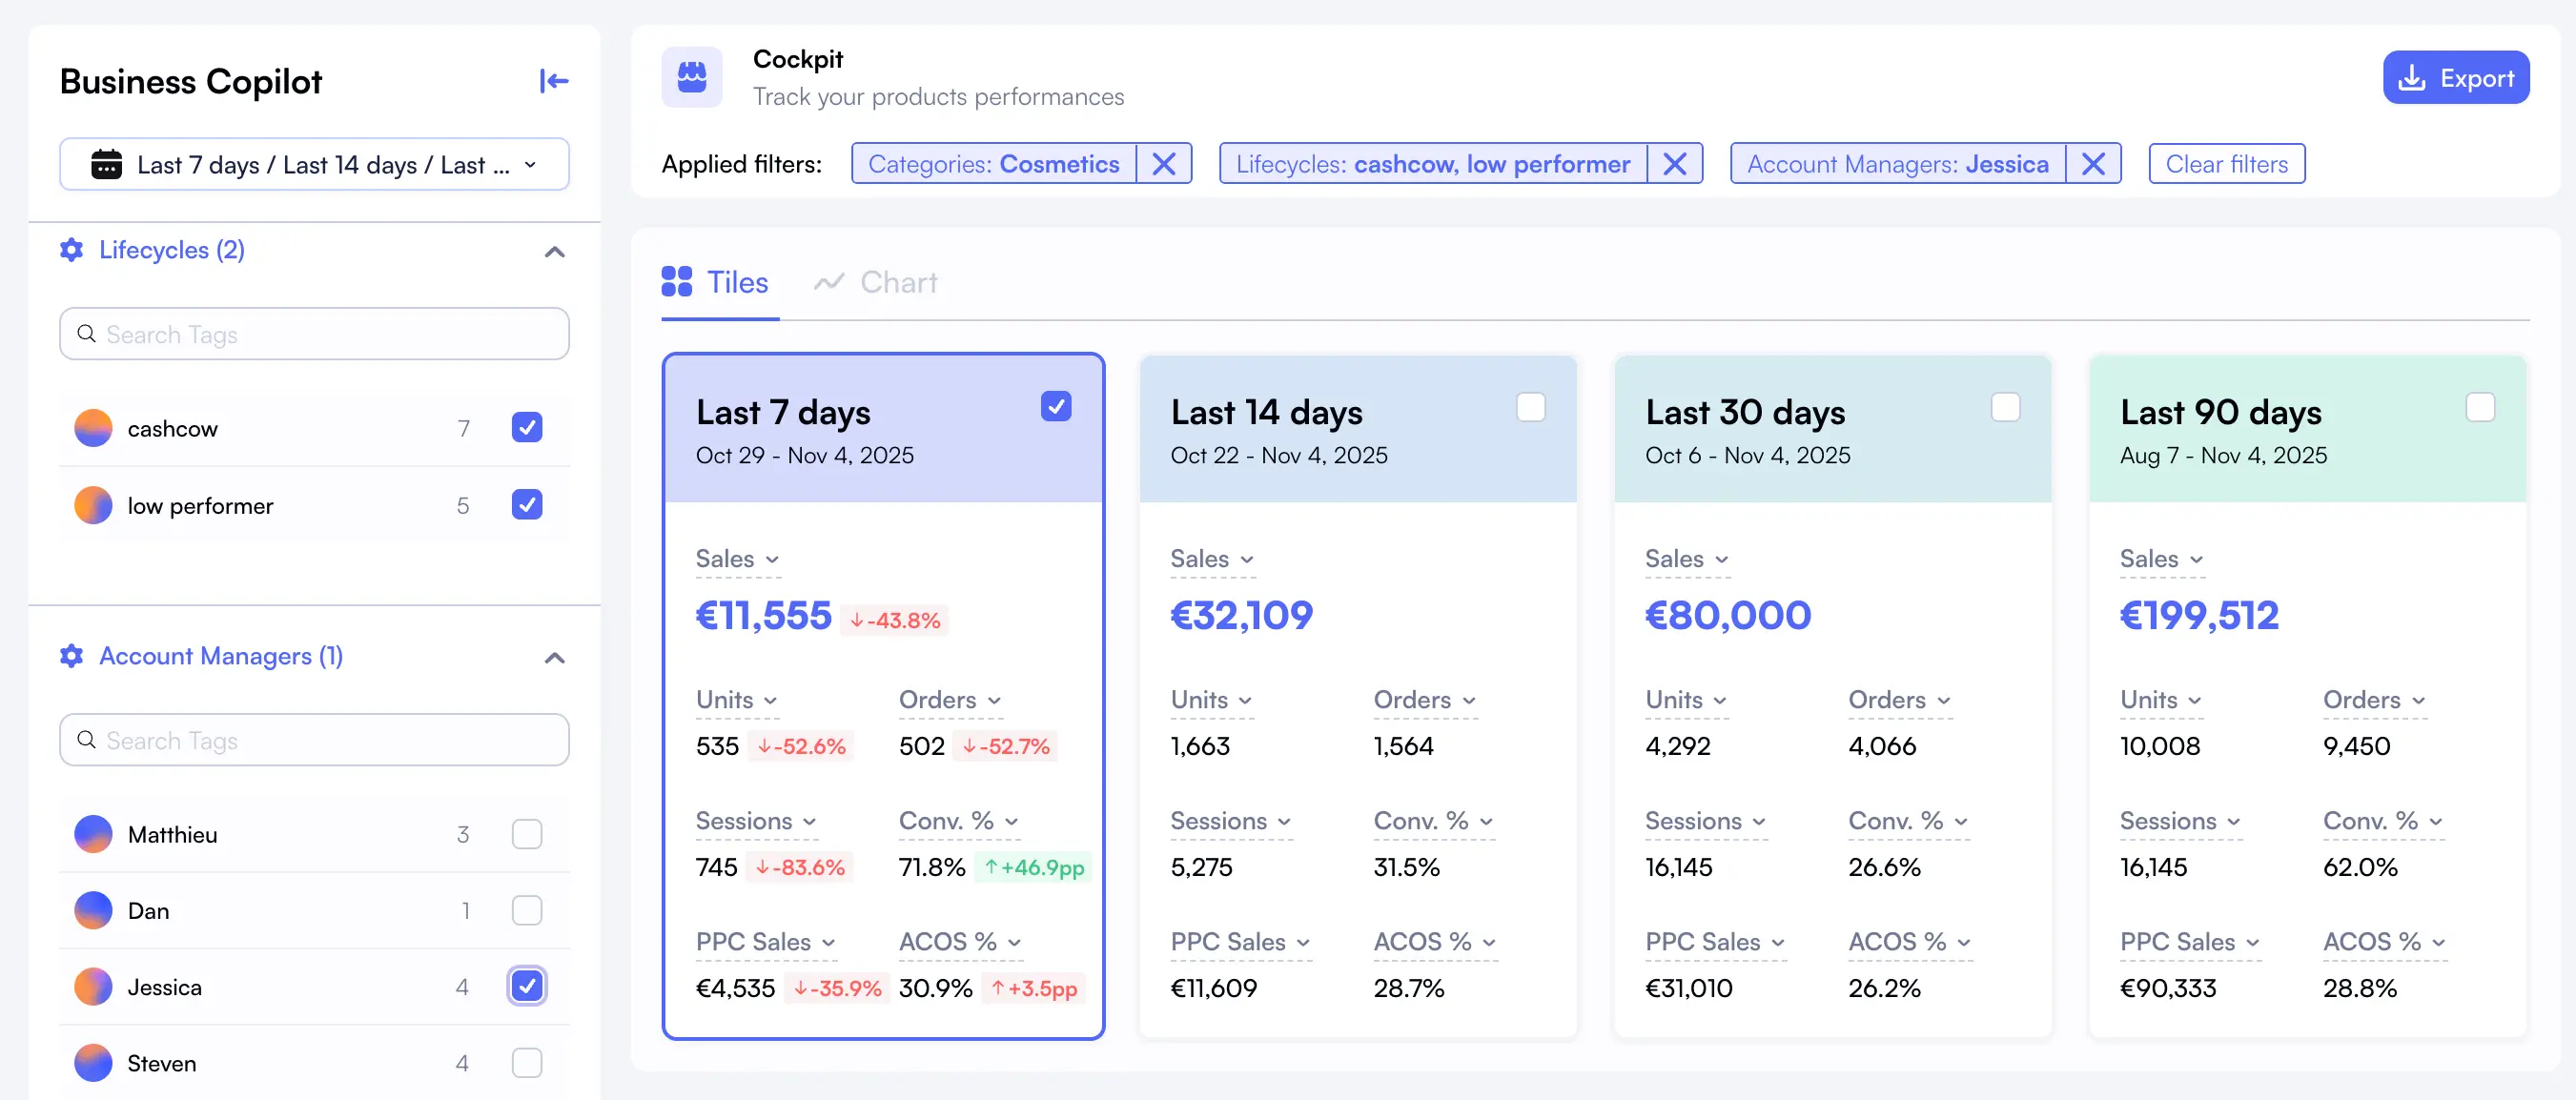
A proper tagging system lets you slice your product catalog by any dimension. Filter by supplier, category, launch date, performance tier, or any custom attribute. Get profit metrics for each segment instantly.
Nova's Custom Breakdowns lets you create unlimited custom tags and see profitability by any segment. Tags sync with your P&L data automatically.
Tagging taxonomy: categories vs. Attributes vs. Performance tiers
Not all tags are created equal. A robust taxonomy uses three types of tags, each serving different purposes. Mix them up and your system becomes confusing. Keep them distinct and you can answer any question instantly.
Categories: What is this product?
Categories are hierarchical, mutually exclusive groupings. A product belongs to one category. They answer "what type of thing is this?"
Examples: Kitchen > Utensils > Spatulas, Pet Supplies > Dog > Toys, Beauty > Skincare > Moisturizers
Best practice: Mirror Amazon's browse categories when possible. This makes cross-referencing easier and aligns with how customers think.
Attributes: What characteristics does it have?
Attributes are non-hierarchical, non-exclusive characteristics. A product can have many attributes. They answer "what's notable about this product?"
Best practice: Use key:value format for clarity. "Supplier:Acme" is more useful than just "Acme" when you have hundreds of tags.
Performance Tiers: How is it performing?
Performance tiers are dynamic classifications based on metrics. They answer "how should we treat this product?" Unlike categories and attributes, these can change based on performance.
Examples: Tier:Hero (top 20% by profit), Tier:Mature (stable, profitable), Tier:Growth (investing to scale), Tier:Watch (underperforming), Tier:Sunset (declining, consider discontinuing)
Best practice: Update tier tags quarterly based on actual performance. Use Nova's Winners & Losers to identify which products belong in each tier.
Pro Tip: Start with 5-7 attribute types
Don't over-engineer on day one. Most businesses need: Supplier, Launch Period, Primary Marketplace, Brand (if multi-brand), and 1-2 custom dimensions unique to their business. You can always add more later. Too many tags too soon leads to inconsistent usage and messy data.
5 tagging strategies for different business models
Your tagging strategy should match how you make decisions. A single-brand seller needs different tags than an agency managing 20 brands. Here are five approaches for common business models.
1Single brand, single marketplace
The simplest scenario. Focus on product lifecycle and supplier tracking.
Focus on sourcing and velocity. Tags help identify winning sources and reorderable products.
Recommended tags:
Source type (Wholesale, Retail arbitrage, Online arbitrage, Liquidation)
Source name (specific retailer or distributor)
Reorderable (Yes, No, Maybe)
Velocity class (Fast, Medium, Slow)
Margin tier (High >30%, Medium 15-30%, Low <15%)
Managing tags at scale
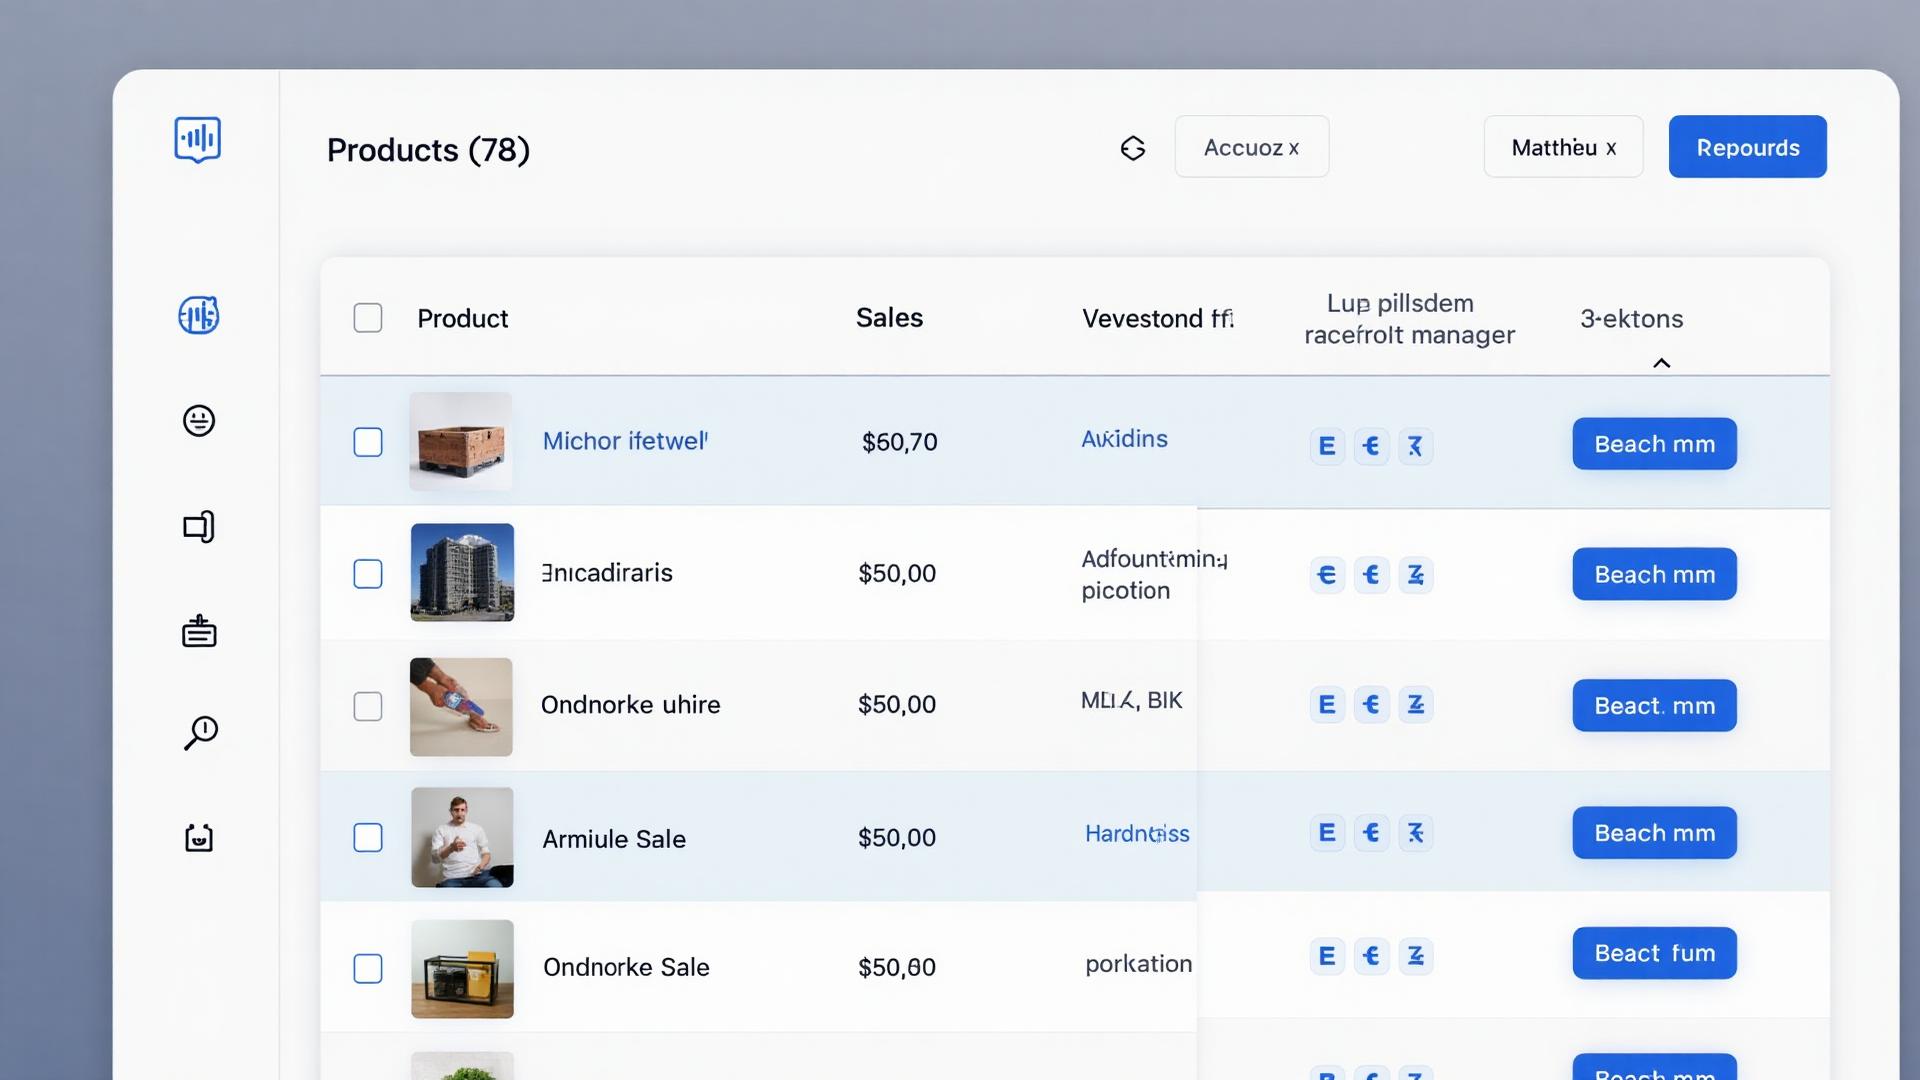
With proper tagging, your product table becomes instantly filterable. Click a supplier tag to see all their products and aggregate margins. Click a launch quarter to evaluate product cohort performance.
Use Nova's Custom Analytics to build saved views for your most common tag combinations. One click to see "Q4 launches from Supplier X with margin above 20%."
How tagging unlocks custom reporting
Tags aren't just for organization. They're the foundation for answering business questions that Amazon's reports can't touch.
Business Question
Required Tags
Report Type
Which supplier gives best margins?
Supplier
P&L by supplier
How are 2024 launches performing?
Launch quarter
Cohort analysis
Should we invest more in Brand X?
Brand + Performance tier
Brand-level P&L
Which product lines need attention?
Product line + Tier
Line performance dashboard
What's our seasonal product exposure?
Seasonal
Seasonality report
Once tags are in place, these reports take seconds to generate. Without tags, each question requires hours of spreadsheet work. Learn more about building these reports in our custom dashboards guide, or explore Nova's Amazon seller dashboard for a unified view.
Migration guide: from spreadsheets to systematic tagging
You don't have to tag everything on day one. Here's a phased approach to migrate from spreadsheet chaos to systematic organization.
1Week 1: Define your taxonomy (2-3 hours)
Before tagging anything, decide on your tag types and values. Write them down. This prevents inconsistent naming later.
→ Choose 3-5 attribute types you'll use
→ Define your performance tier names and criteria
→ Decide on naming convention (Supplier:Acme vs supplier_acme)
→ List your top 10 most important segments to track
2Week 2: Tag your top 20% (4-6 hours)
Start with products that drive 80% of your profit. These deserve attention first. Use bulk tagging if available.
→ Tag each with supplier, launch date, performance tier
→ Verify tags are appearing correctly in your analytics
3Weeks 3-4: Complete the catalog (ongoing)
Tag remaining products in batches. Aim to complete within a month. After that, make tagging part of your product launch checklist.
→ Set daily goal (tag 50 products/day)
→ Use bulk import if you have existing spreadsheet data
→ Update launch checklist to include tagging step
4Monthly: Maintain and update
Tags require maintenance. Performance tiers change. Products get discontinued. Build a monthly review habit.
→ Review and update performance tiers quarterly
→ Tag new products within 1 week of launch
→ Archive tags for discontinued products
→ Audit for inconsistent naming
Bulk Import Tip
If you have existing spreadsheets with product categorization, most tagging systems accept CSV imports. Export your spreadsheet with SKU and tag columns, clean up any inconsistencies, and bulk import. This can save hours compared to manual tagging.
Frequently asked questions
If you have more than 10 tag types, you're probably over-complicating. Start with 5-7 and add only when you have a clear use case. Unused tags create clutter and reduce adoption.
Tag at parent level for attributes that apply to all variations (supplier, launch date, category). Tag at child level only for variation-specific attributes (size, color performance tiers).
Document your taxonomy in a shared reference. Include tagging in SOPs for product launches. Run a monthly audit to catch inconsistencies. Make tags a required field, not optional.
Yes, but be careful with historical data. Changing "Supplier:Acme" to "Supplier:AcmeCorp" may break historical reports. Add a new tag value and migrate products gradually rather than bulk-renaming.
Amazon's attributes (brand, category, dimensions) are required for listing. Your tags are for internal organization and don't appear on Amazon. They're complementary systems for different purposes.
Start organizing today
Product tagging is boring infrastructure work that nobody wants to do. That's exactly why it creates competitive advantage. The sellers who build systematic organization can answer questions in seconds that take their competitors hours. They spot patterns faster. They make better decisions.
You don't need to tag everything today. Start with your top 50 products. Define your taxonomy. Build the habit. Expand from there. In a month, you'll wonder how you operated without it.